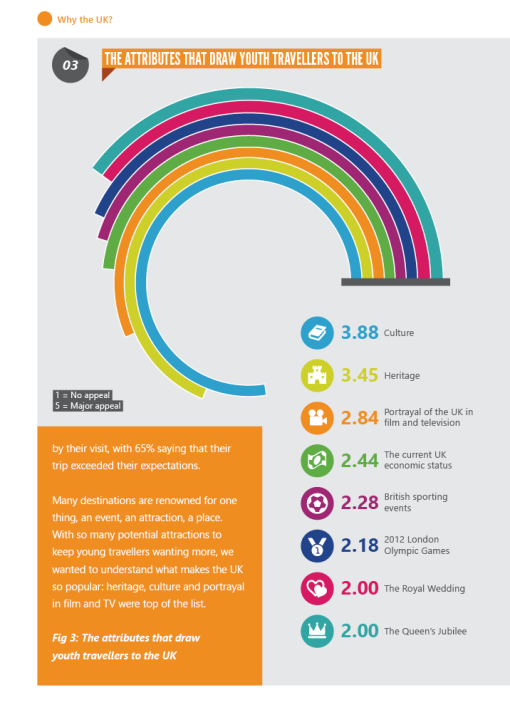
This is the second part from the project I’m currently working on. This project has been really focused on infographics and using different techniques in Illustrator.
A few notes and tutorials from my internship.
This is the second part from the project I’m currently working on. This project has been really focused on infographics and using different techniques in Illustrator.
Posted by in Personal Work
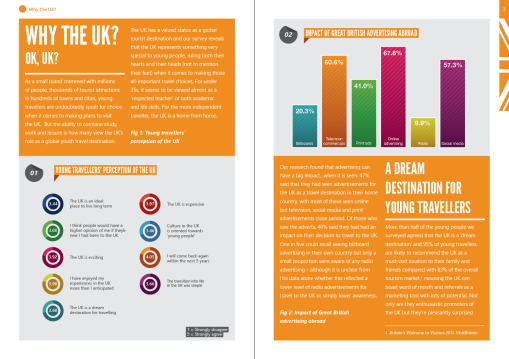
This is the first spread from the project I’m currently working on. This project has been really focused on infographics and using different techniques in Illustrator.
Posted by in Personal Work
Not so great at illustrating and using Illustrator? You’re in the right place. As of last week I didn’t consider myself an Illustrator… thanks to this website and a few others I think I’ve greatly improved! If you’re interested in learning how to use Illustrator and want to illustrate, this is the website for you.
Posted by in Tutorial
My supervisor showed this website to me last week and I found it pretty useful. It has a lot of tips & tutorials for free use which are super helpful if you’re not as good as using Illustrator (like myself). Feel free to check it out!
Posted by in Tutorial
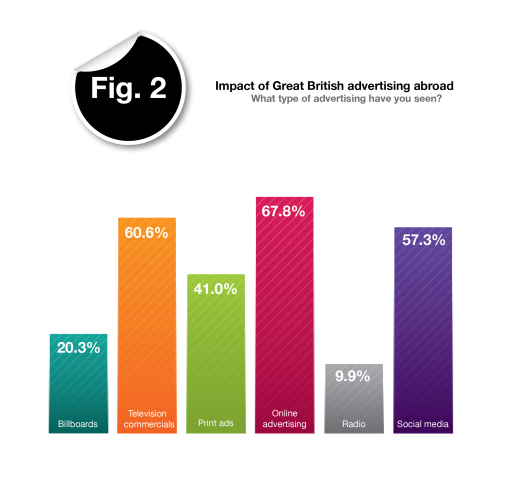
This is the infographic I designed today for work. You can see I used both tutorials I posted to create my graph and peeled sticker. I’m pretty happy with the results of it!
Posted by in Personal Work
Tutorial on how to make a peeled sticker
Another thing I did today was illustrated a peeled back sticker. This one was a pretty easy trick but I found it pretty useful. Just use the pathfinder and the gradient tool and in no time you’ll have a peeled sticker of your own!
Posted by in Tutorial
A really useful tutorial for basic Infographics
Today I had to work on creating some infographics for a book I’m working on. After doing some research and finding some pretty sweet images, I came across this super detailed tutorial on how to make some basic infographics in Illustrator. It has an example of two kinds of bar graphs, a pie chart, and then a world map. It also has the files available to download so you can work along with the tutorial and see if you’re doing things correctly.
If you haven’t, or even if you have worked with infographics before it’s defiantly worth checking it out and scrolling through. You might just learn something!
Posted by in Tutorial

Recent Comments